Pironman 5 Dashboard empty

Hello,
I’m new here.
The problem still exists.
I’ve tried everything and the dashboard is still blank.
You can’t even change the settings in the terminal anymore.
I’ve tried all the tips here and nothing helps.
It worked wonderfully on my first Pironman5.
My second one doesn’t work.
New SD card, new Raspberry Pi 5, new case, and also new Pironman 5.
I need help.

Greetings from Germany.

It is recommended that you reinstall the bookworm system and then go ahead and follow the tutorial steps to install the pironman5 software:

https://docs.sunfounder.com/projects/pironman5/en/latest/set_up/set_up_rpi_os.html#downloading-and-installing-the-pironman5-module

Provide us with a complete screenshot of the pironman5 installation process so that we can help you analyze the problem.

Are the commands in the terminal working properly, and are there any errors reported after running the commands? If so, please provide us the screenshot of the error report.

1 Like

Genius - Perfect! Worked like a champ. My pironman5 InfluxDB was 3.5Gb. keeping Data for the last 6 months. I guess I need to trim the DB every 3 months or so. Now, how to I limit the mariadbd & influxd services to only start up like 5 listeners instead of 10 each?

If the dashboard log file has duplicate listening files, you can just delete them manually.
There is a delete button on the right side of the log file.

Hi, Im a new user of Pironman5 Max and do experience this issue too. Every time I shutdown my RPI5 4GB and/or close one of the Portainer stacks (Frigate and an other) the dashbord is empty.
After using the 4 line action to stop service, remove influx db and was and restart, the dashboard is displaying data. How can I check and repair the Pironman influx db health without removing all historic data? Txs

Thanks, had the same issue, solved !

HansS, please try the method provided by apstudio to see if it resolves the issue.

Yes, we have also identified a similar problem. The new version has addressed it. However, Pironman5 has not yet undergone compatibility testing with the new version. We will test Pironman5 in the future, and once testing is complete, the new version will be released.

Hello @SunFounder_Moderator,

It seems this issue still continue, after first installation it was working properly but when restarted the raspberrypi Pironman 5 Dashboard gone.

I think the issue is because of the influxdb which stops after a while maybe because of data size limitation.

I already executed below commands which solve the issue but after a while later (1-2 hours) dashboard gone again.

sudo service pironman5 stop
sudo rm -fr /var/lib/influxdb/data/pironman5
sudo rm -fr /var/lib/influxdb/wal/pironman5
sudo service pironman5 start

I am using PM Dashboard v1.2.19 in Pironman 5. Whenever I open the dashboard it sends the request to /api/v1.0/get-data and fails with error Not found

Service seems working without any issue

$ neofetch
OS: Debian GNU/Linux 12 (bookworm) aarch64
Kernel: Linux 6.12.47+rpt-rpi-v8
Host: Raspberry Pi 5 Model B Rev 1.0
Uptime: 1 day, 20 hours, 59 mins
Packages: 2739 (dpkg)
Shell: bash 5.2.15
WM: labwc
Terminal: /dev/pts/0
CPU: Cortex-A76 (4) @ 2.400GHz
Memory: 4239MiB / 7955MiB

Boot : Samsung 980 NVME SSD (512 GB)

You can find the all detailed logs of the pironman5 : Dropbox

There are several reasons why the dashboard might be empty. In your case, there are no errors in the logs, but the data cannot be retrieved. We have encountered similar situations before.

Previously, the issue we encountered was caused by a mismatch between the time the data was recorded and the time used for display. We are still not entirely sure how this discrepancy occurs. However, it can typically be resolved by clearing the historical data.

You can try clearing the data in the settings. Please check if the dashboard remains empty after doing so. In our experience, after clearing the data, the issue of the dashboard failing to retrieve data usually does not reoccur.

Hi @SunFounder_Moderator

I think I found the issue at least about pironman & influxdb’s extreme resource usage and crashing the pironman dashboard.

it seems influxdb every second retrieve the sensor data and also at the same time (1 second) it Continuously writes data points every few seconds to influxdb which has also no retention policy so that it consumes lots of cpu, memory and after a while start crashing.

1. optimize InfluxDB

Limit how long data is stored (default was unlimited) so that change it to 1d or 7d up to you.

$ influx
> USE pironman5;
> CREATE RETENTION POLICY "1d" ON "pironman5" DURATION 1d REPLICATION 1 DEFAULT;
> exit

$ sudo systemctl restart influxdb

2. optimize pironman (Write Frequency)

Reduce Write Frequency, Change the pironman Dashboard’s data_interval period from 1 second to 10 seconds or more.

sudo nano /opt/pironman5/venv/lib/python3.*/site-packages/pironman5/config.json

// Change **data_interval** value from 1 to 10 (or 60) 

Recommended Values

  • data_interval = 1: Default (writes to InfluxDB every second) - High resource usage
  • data_interval = 5: Good balance - reduces writes by 80%
  • data_interval = 10: Recommended for resource savings - reduces writes by 90%
  • data_interval = 60: Minimal resource usage - only writes once per minute
sudo systemctl restart pironman5

Check the final configs.


$ sudo pironman5 -c

{
“system”: {
“data_interval”: 10, // Changed from 1 to 10 (or 60)
“rgb_color”: "
“oled_sleep_timeout”: 0,
“debug_level”: “INFO”

}
}

voila!
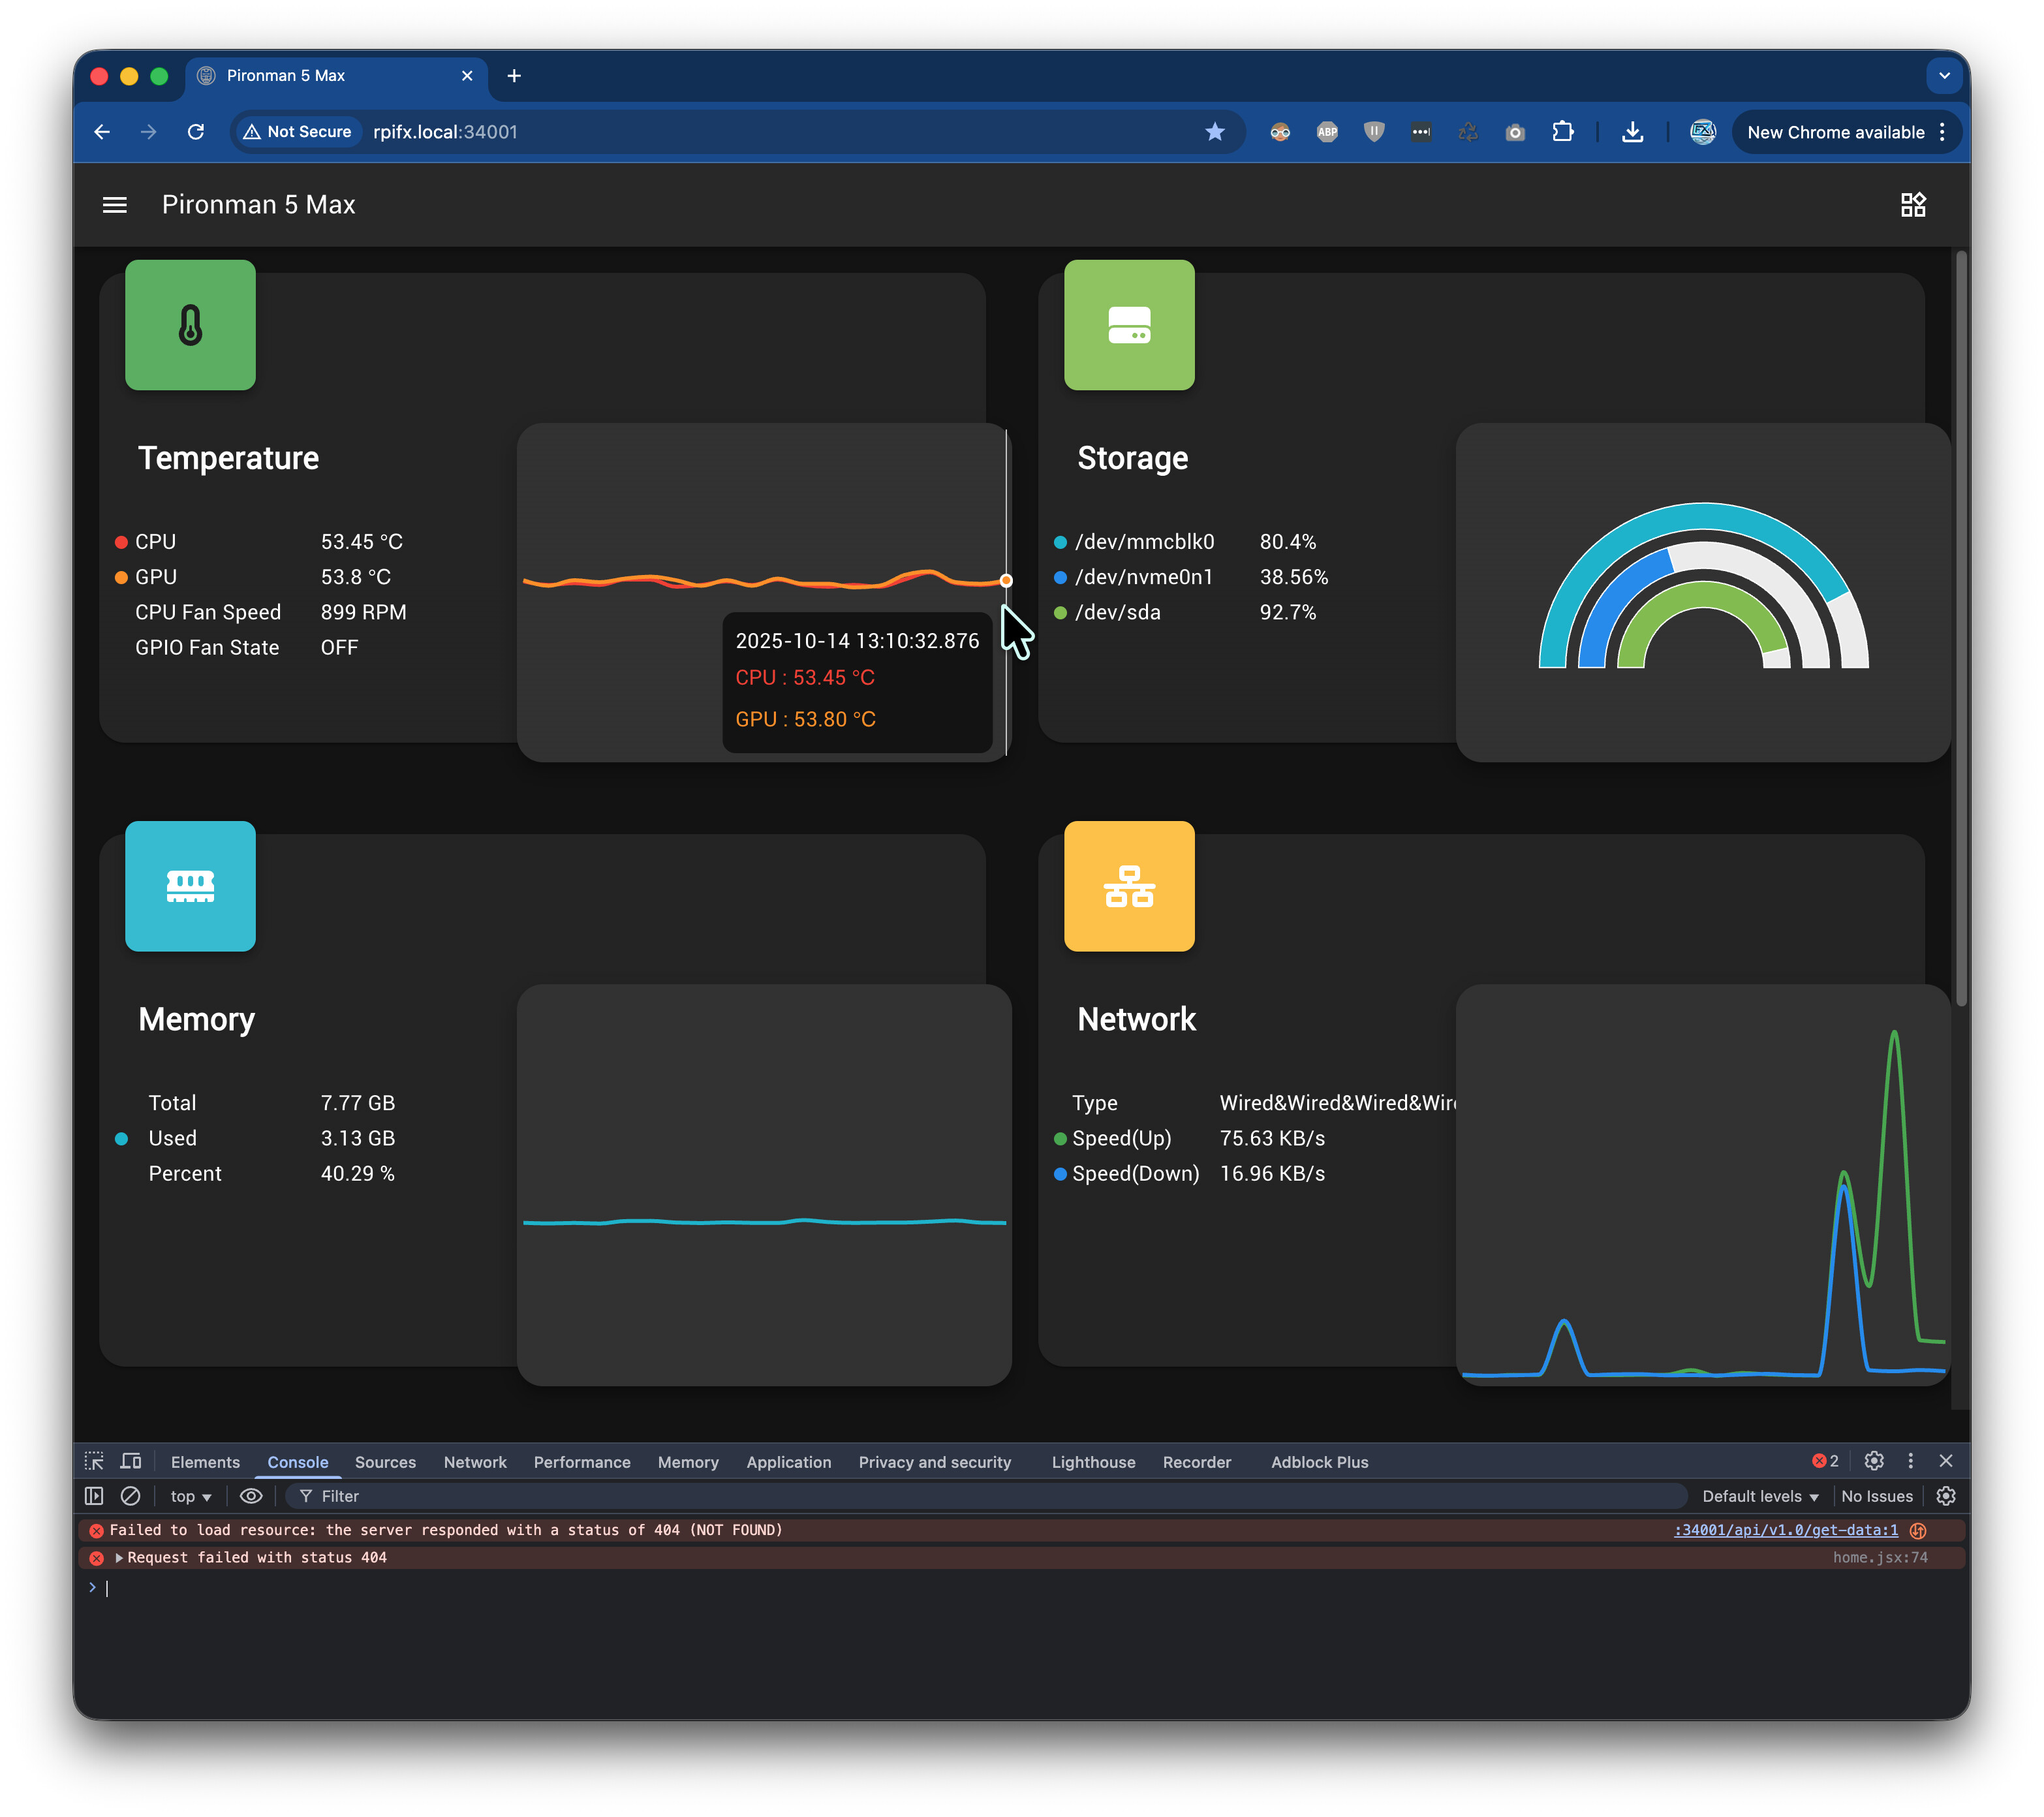
dashboard working after 5 hours later and still showing the sensor values as 10 seconds window frames.
(btw, this message still continue on console log Failed to load resource: the server responded with a status of 404 (NOT FOUND) :34001/api/v1.0/get-data but doesn’t affect the dashboard)

Optional Settings for influxdb
sudo nano /etc/influxdb/influxdb.conf

[data]
cache-max-memory-size = “25m” # Reduce from default 1GB
cache-snapshot-memory-size = “25m”
cache-snapshot-write-cold-duration = “10m”
compact-full-write-cold-duration = “4h”
max-series-per-database = 10000
max-values-per-tag = 1000

[coordinator]
write-timeout = “10s”
max-concurrent-queries = 0
query-timeout = “0s”
log-queries-after = “0s”
max-select-point = 0
max-select-series = 0
max-select-buckets = 0

[http]
enabled = true
bind-address = “:8086”
auth-enabled = false
log-enabled = false # Disable HTTP logging
max-row-limit = 0
max-connection-limit = 0

2 Likes

Instead of using the Pironman’s own dashboard (pm_dashboard) I built a simple Grafana Dashboard which seems more accurate and looks fancy without consuming more resources.

you can find and download it from GitHub - fxerkan/pironman_grafana_dashboard: a Grafana dashboard for Pironman 5